Hadoop vs Spark: a tale of data manipulation

BLOG-1507-bigdata

Last November this post by Alex Woodie from Datanami made quite an impression on the Big Data community.

Central to this post was this diagram taken from Google Trends showing Spark in blue climbing dramatically and overtaking Hadoop in red. Even if you didn’t read the article, you got the gist of it by looking at the curves. Such is the power of good data visualization!
image1

And so the rumor spread like wildfire: it was such a good story, we all wanted to believe in it.

I told the story too during the training sessions I delivered until one day, a bright participant with a curious mind asked if we could check the facts directly using Google Trends.

¡No problemo! Let’s check the facts!

I entered Hadoop as the first search term in Google Trends and Spark as the second one. Then Google reminded me that Spark could be many things: a spark plug, a car, some kind of transmitter, a fictional character. Ok, I got it. I needed to be more specific, so I entered ‘Apache Spark’, hit return and obtained the following result.

image2

This is, ahem, much less impressive!

It’s starting to ramp up like Hadoop six years ago but it is nowhere near the tsunami depicted by Datanami.

For me this is the correct set of search terms since none of them are ambiguous. There are no characters, cars or things called Hadoop besides Hadoop the software. If I google Hadoop, all the links returned will be relevant. There is no need to be more specific.

But just for kicks, let’s compare ‘Apache Hadoop’ and ‘Apache Spark’.

image3

Bingo!

This is how they managed to get this spectacular diagram: by being unnecessarily specific for the Hadoop search term.
This is so incredibly stimulating: I want to be creative too.

Let’s compare ‘Apache Spark’ and ‘Apache Hadoop Open Source Software’.

image4

Voila! I made Hadoop completely disappear!

Can I make Spark disappear too?
Of course! All I need is to compare ‘Apache Spark framework’ and Hadoop’.

image5

I am unstoppable! Can I make them both disappear?

Mais oui ! Although with some help from a third party.

image6

OK enough silliness! I think there are three lessons that can be drawn from these experiments.

I have included my search terms in my screen shots so that you can reproduce my searches at the cost of showing you some French. Reproducibility is a key ingredient in data science. It’s ironic that a news portal about Big Data should present data in such a misleading way.

Judging from Google Trends, Spark is not taking over Hadoop yet but it is taking off. So it definitely is a technology worth monitoring in the new and fast paced ecosystem of Big Data.

The idea that the popularity of Hadoop has peaked is not validated by the data provided by Google: it is in fact still growing.

This article was originally posted on the Neoxia blog site: http://blog.neoxia.com/hadoop-vs-spark-a-tale-of-data-manipulation/.

Using Hadoop to perform classic batch jobs

BLOG-1506-bigdata

As part of my job in Neoxia, I deliver two Big Data training courses for Learning Tree in France: One is an introduction to the fundamentals and the other is on developing Hadoop-based solutions in Java. The first one has been quite successful lately, so I get the privilege of revealing to my students the magic of counting words with Hadoop on a weekly basis.

To introduce this highlight of the training session, we first consider the traditional approach a developer would take to counting the words in a set of text files.

It goes something like this in pseudo Java:

code1-bigdata-1506

Then we take a few minutes to discuss the pros and cons of this approach.
Eventually we all agree that since it is sequential, it cannot scale and therefore that it’s incredibly naive.

And until recently I forgot to add by today’s standards.

But now I have a brand new perspective on this snippet of code: I no longer consider it as the result of an uninspired effort from a Java beginner but as the heritage from the golden standard for Cobol batch jobs from the 80’s: for each customer perform some kind of processing.

Those jobs are still out there running a significant size of the world’s business.

Like word counting, could they too benefit from a map reduce approach?
Let’s take a monthly billing job for instance.

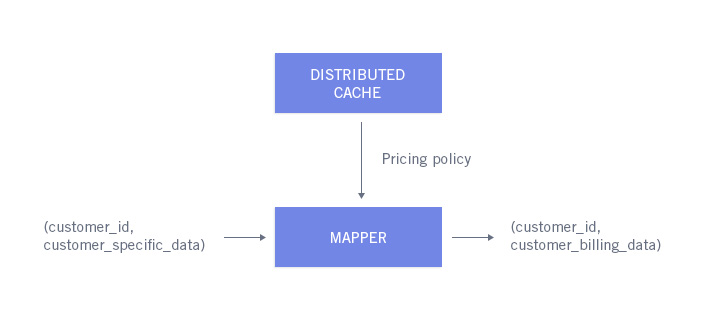
First let’s examine how we could technically use Hadoop do perform this job. Billing a customer is the result of applying a common pricing policy to customer’s specific data. So provided we manage to fit the pricing policy in a distributed cache, the billing could take the form of a map-only job like the one below:

img-bigdata-1506

What would the potential business case be like if we used Hadoop to perform billing ?
Is it a good idea to bill faster ? Ask your favorite CFO and prepare to be amazed: the guy can actually smile. Some of these legacy jobs have grown so large that they span several days thus losing precious days’ worth of cash flow.

Is it worth the trouble to port legacy billing code to Java-based Hadoop code? It could be. The documentation of 30 year old code is likely to be in poor shape. Being able to document the new code with unit tests would give the company confidence in its ability to change the pricing policy or launch new products with unprecedented speed of execution. Reducing the footprint of legacy hardware and software in your information system is also a step in the right direction. It is the only way to eat an elephant: one bite at a time.

There are many misconceptions around Big Data.
One of which is that there is a threshold of data volume below which you can continue to rely on traditional solutions and above which you need to use the new generation of tools. Framing the problem in those terms often leads to dismiss Big Data since most companies do not have use cases involving petabytes of data. And maybe that is the implicit request underneath the question: can I continue to do IT in my tried and tested way please ?

This approach misses the point: the new tools that are associated with Big Data bring to the table solutions to problems that were not well addressed by the former generation of tools. Solution architecture decisions should not be based on a simple rule like this one:

code2-bigdata-1506

Instead those decisions should be based on a more relevant set of questions such as:
• can this job benefit from parallel processing ?
• what is the most efficient way to store this data? tables ? documents ? graphs ? key-value pairs ?
• and by the way, how badly does this data really need to be stored on premises ?

There are more use cases for the new generation of tools than just taking over when the volume of data makes them mandatory.
What if Hadoop became the new golden standard for batch processing ?

This article was originally posted on the Neoxia blog site: http://blog.neoxia.com/using-hadoop-to-perform-classic-batch-jobs/.

Technical debt: paying back your creditors


Would you still go for a swim if you saw that sign on the beach?

Probably not.

Most people would agree that a swim in the sea is not worth dying for.


Now then, what drives people to cut corners in software engineering?

I think the factors that are weighed in to take these decisions are diametrically opposed to those of swimming in shark infested waters:

  • The immediate gain looks substantial
  • The consequences are far off and uncertain.

The Technical Debt metaphor mitigates the second factor but it might not be enough to deter compulsive corner cutters.

As I explained in a previous post, the technical debt involves several creditors because what drives people to cut corners on software quality usually has ar least already made two more victims along the way

.

Let’s study what would be the first steps of paying back the technical debt of a legacy application that has become a big black box. We’ll assume that the strategy to fix the application has been agreed upon, that a static analysis tool has been procured, installed and configured and that all the violations are identified, classified and prioritised. 

Of course this project is mission critical otherwise the management would not have bothered. So in order to start fixing the code of this big black box with the level of confidence required, you need to build a test harness. And to build the test harness, you need to discover what it is supposed to do, i.e. the requirements.

In other words you have to pay back the first creditors first.

1) Kaizen time

That does not mean you must restore dusty requirements documentation and manual test scripts like precious works of art. 


Rather you want to take advantage of a lesson and an opportunity. 

The lesson is staring right back at you: the cost of maintaining those assets was to high for the corner cutters in your organisation.

The opportunity comes from the time that has passed since those assets were created. Each year brings new ideas, methods and tools, a growing number of which are free.

It’s time to take a Lean look at those assets. For your work to be durable you don’t want them to stick out like big fat corners screaming «Cut me please !». Some of the forms these assets took in the past, such as large documents full of UML diagrams and manually written executable test scripts, were simply too high maintenance and should quietly go the way of the dodos.

Replace documents with structured tools that will store your requirements and use a simple framework like a keyword driven test automation framework to generate your tests. So shop around for the latest tools and methods and find the combination that works for your organisation.

2) Discover the requirements 

For this you need the skills of an experienced tester and of a business analyst.  He may not like it but the tester should have developed a knack for dealing with black boxes and reengineering requirements. So he should be able to figure out what the black box does. And with the input of the business analyst as to why the black box does what it does, together they should be able to come up with a set of requirements. The fact that they are two different individuals ensures that the requirements are well formulated  and can be understood by third parties. Furthermore the business analyst helps prioritise the requirements. Store the requirements in the tool you previously selected.

3) Build the test harness

Next, the Most Important Tests (MITs) can be derived from the prioritised requirements. The tester can write those tests using the keyword driven framework. Even if those tests will never be automated, it is still a good idea to use one such framework for consistency purposes. But really, if at all possible, by all means use the framework to generate the executable test scripts. Remember they should only be the most important ones. 

The last remaining obstacle between you and acceptance test driven refactoring bliss is test data. And this is often where test automation endeavours grind to an halt. Fortunately, the late frenzy about data has spawned a vibrant market for data handling tools and some of them have comprehensive data generating features. Talend is one of them. Personally I have recently used Databene Benerator and found it both reliable and easy to learn.

Mastering your test data makes a huge difference, it’s the key to unlock test automation. So it’s worth investing a little time in the tool you chose in order to achieve this objective.

Et voilà, now that you have paid the first two creditors you should be in a good position to pay the last one. Not only that, you have a built a solid foundation to keep them from coming back.

This article has also been posted on the www.ontechnicaldebt.com site: http://www.ontechnicaldebt.com/blog/technical-debt-paying-back-your-creditors/.


A better name for testing

The word «testing» conjures up images of people manually entering values and clicking on buttons according to a script. The implicit low value of the word contaminates the perception of the activity: testing is donkey work that can be easily off-shored, it is cheap and so should testers.

In a previous post, I offered the following definition for testing: a strategic business project which seeks to confirm the alignment of systems with stakeholders’ expectations for an optimum initial cost in a manner that can sustained or, even better, improved over time.

Focusing on the execution part of the process is a tragic mistake.

What other professions are so poor at selling themselves?

Imagine a world where every profession adopted the same literal approach to naming themselves.

 Instead of We would have
Finance Spreadsheeting
Marketing Fonts Obsessing
IT Cabling
Procurement Purchase Order Processing
Human resources Hiring & Firing
Security Fear Mongering
Sales Contract Signing
Communication Branding & Blanding

Do we use the names in the right column (on a regular basis as opposed to from time to time in fits of rage)?

No, we don’t.

Testing is an engineering process.

What is the desired output of this process?

Quality.

Let’s call it quality engineering then.


A specific fishbone diagram for software problems

In 1968 Kaoru Ishikawa created a causal diagram that categorised the different causes of a given problem. The fishbone diagram, as it is also referred to, was particularly well suited for the manufacturing industry where it was successfully used to prevent potential quality defects.

Ishikawa Diagram

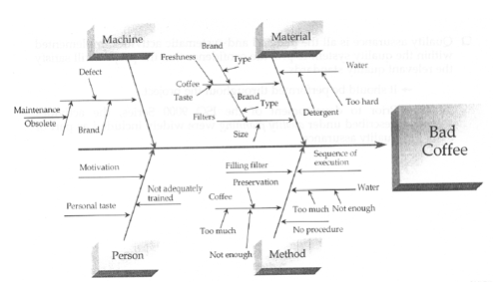
One way to look at the diagram is to see it as a recipe: use all the best ingredients and you will be rewarded with a delicious dish, degrade the quality of one our several ingredients and you get a less savoury result.

For instance here is the recipe for bad coffee.

Bad CoffeeIt is very tempting to try and use this diagram in the context of software engineering.

Don’t we all have our own secret recipe for bad software?

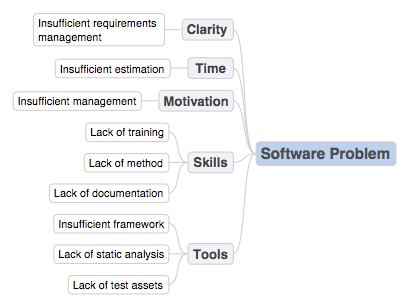
Unfortunately, this diagram is not as well suited for software engineering as it was for manufacturing. I have therefore come up with a new version of this diagram for software problems.

Using the recipe metaphor, what are the ingredients required to build great software?

For me it’s clarity, time, motivation, skills and tools.

Clarity (I don’t understand it)

To write good software, having clear requirements is clearly required!

Clarity should be achieved through good requirements management practices such as the ones described in my previous article.

Time (I don’t have the time to do it)

Estimations are the output of planning processes. If not enough time has been allocated for the task then one might be tempted to cut some corners and put the quality of the result at risk.

Motivation (I don’t want to do it)

If all the other ingredients are gathered then the developer can technically do what is expected of him. But will he do it? Will the resulting code be stellar or botched? That depends on its motivation. It’s the project manager’s job to make things happen.

Skills (I don’t know how to do it)

This one covers both expertise and method because one can compensate for the other. An experienced programmer can debug a program in a language he doesn’t know because what he lacks in expertise he can make up for with method. Granted, he will take more time to complete the task than an expert.

Tools (I don’t have the tools to do it)

Tools also have an impact on software quality. Building software on top of a solid framework reduces the amount of code to write and therefore the likelihood of introducing mistakes. Static analysis tools can catch potential issues as code is written and further improve the quality of the code. Lastly, the availability of test assets increases the confidence of the team to improve its code while keeping the alignment with the requirements.

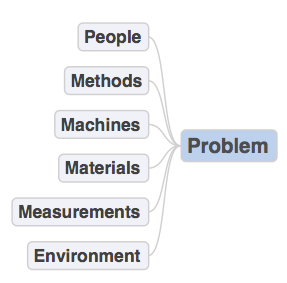
Software Problem Diagram

This diagram can be used for risks identification purposes and thus can guide the actions of the project manager in order to achieve better software projects.

The technical debt involves several creditors

The Technical Debt is a powerful metaphor. It helps to explain in two minutes the stakes of code structural quality to anyone. Although it’s been around for quite a while, it’s has become very popular recently and pundits are still debating its definition.


For the sake of clarity, the definition I’ll be using is the one from Dr Bill Curtis:
«Technical Debt represents the cost of fixing structural quality problems in production code that the organisation knows must be eliminated to control development costs or avoid operational problems.»


Before this measure was introduced, developers had no means of explaining to their management the consequences of their decisions and the sighs, the rolling of their eyes, the shrugging of their shoulders and warnings such as «the whole damned thing needs to be rewritten from scratch» may have often been exaggerated and were not taken seriously.


Until they were true and it was too late.


So the technical debt is a huge step forward adding a new dimension to improved IT governance but for this measure to be efficient we should be able to act upon it and, for instance, try and fix that big legacy code that is crippling our organisation’s agility.


But it’s not that easy.


Because at the level of maturity where there are many structural issues in the code, tests are usually long gone. And truth be told, requirements and test data are also often missing.


It’s the result of the spiral of debt:  the worse the quality of an application, the more difficult it is to improve it. So the path of least resistance is to let quality degrade with each new release. The process stops when the application has reached the following steady state: a big black box with no test assets, no requirements and a generous helping of structural code issues.
Technical Debt
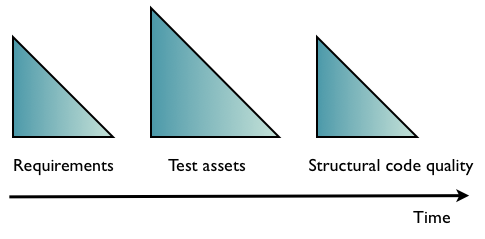
Thus there are several creditors for the technical debt and there is an order with which they need to be paid off: requirements first, then test assets and code quality.


Sounds like rework?


That’s because it is.


Is the critical path becoming an endangered specie?

Before scheduling software packages were available, engineers would painstakingly perform the forward pass and backward pass algorithms manually with the occasional help of a trusty slide rule to identify the critical path of their projects.

At the time, schedules were true to their original purpose: simple graph models that helped understand how changes would impact the delays and what tasks should be looked at more closely in order to reduce the global duration of projects.

Fast forward to the present, many scheduling software packages have grown into ALM tools and students for the PMP certification discover during their training that there is actually a graph underneath the Gantt charts they have used on a daily basis for several years.

The last nail in the coffin of the Pert graph is a consequence of the feature race that takes place between ALM tools. Since the selection of these tools is a box checking exercise, features are added on top of one another and time tracking is one of the first.

It’s an easy sell, it´s one of those ideas that looks great on the surface but whose flaws are safely buried in technical layers.  Since all of the organisations’ projects are in the same database why not take this opportunity to track time and therefore costs?

So the package is bought, users are trained and trouble begins.

With their original purpose lost from sight and with the new mission to track time, schedules quickly morph into monster timetables: tasks not related to the production of one of the projects’ deliverables are added, dependencies are removed to ensure stability and easy timesheet entry. Until the Pert graph is no more, the critical path is lost and tasks have become budget lines.

Managing costs and delays with the same tool is a complex endeavour and for many organisations it is too complex. The costs side often wins because it has more visibility and it is easier to deal with and thus the ability to simulate the impact of scenarios on projects’ end dates is sacrificed.

A definition of testing

Testing is changing: analysts comment on the promising trend of the market, big players jump in to get their shares, customers come to the realization that the “Ready, Fire, Aim” school of software engineering is becoming outdated.

Fine, testing  is no longer the “necessary evil” but what is it really?

In order to set the record straight,  I offer the following definition:

Testing is

  • A strategic business project
  • Which seeks to confirm the alignment of systems with stakeholders’ expectations
  • For an optimum initial cost
  • In a manner that can be sustained or, even better, improved over time

It is a project because the validation phase needs to be planned and because measurable exit criteria need to be defined in order to end it. This project is driven by the business, because those exit criteria must be aligned with the users’ priorities.

It is strategic because, for an organization, the ability to implement its vision depends on its ability to align its information system.  Its cost can be optimized because, as the work of quality control pioneer, Joseph Juran, has shown, a balance can be struck between the costs of fixing defects and the costs of preventing defects.

Finally to make the investment perpetuate, it is smart to anticipate that the same effort will need to be carried out each time the system is updated and take some measures accordingly such as automating the most critical tests.